| Brownian motion is easier to understand in the one-dimensional case. |
| Suppose a particle (red) moves only along the y-axis. |
| We can graph (green) its motion as a function of
time (t on the horizontal axis). |
 |
| Click the picture to repeat. |
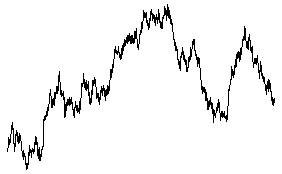
| To begin to develop a visual sense of the properties of 1-dimensional Brownian motion, here
is the graph of a longer simulation, 2000 points. |
| We call this function Y(t). |
 |

