Random Fractals and the Stock Market
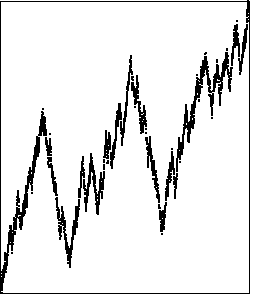
Surrogates of the Stock Market - Trading Time Example 2
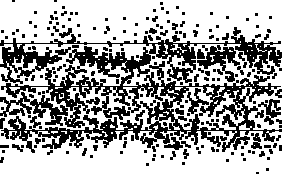
Price and Trading Time Graph and Difference
On the left we see the 8
th
iterate sampled at 3128 equal time steps.
On the right is the graph of successive differences.
Return to
Example 2
.