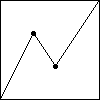
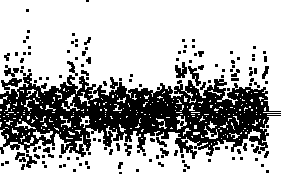
| Here are the successive differences of the cartoon data, where B1 and
B3 are 0.1σ from the mean. Note most differences
lie in bin1 and bin4, with few in bin2
and bin3. |
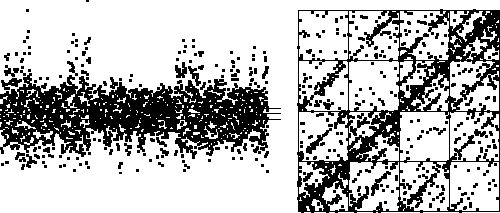
Here is the IFS driven by these differences as data points.
The most visible features are (i) most IFS points
lie on the line connecting the lower left and upper right corners of the square, and
(ii) in the squares with address 2 and 3, almost all of the points connect the lower left and
upper right corners of these squares. Feature (i) results from the preponderance of
data points lying in bin1 and bin4. Moreover, to the limit
of our vision, data points land in these bins in all combinations. Feature (ii) is the
result of data points in bin1 and bin4 being followed occasionally
by data points in bin2 and in bin3. Note consecutive data points
rarely land in bin2 (the square with address 22 contains few IFS points), and
even fewer consecutive data points land in bin3 (the square with address 33
contains only 3 IFS points). |


