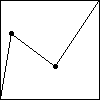
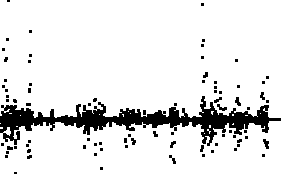
| Here are the successive differences of the cartoon data, where B1 and
B3 are 0.1σ from the mean. Note most differences
lie in bin1 and bin4; it appears that few in bin2
and bin3
because these bins cover such a small range. |
Here is the IFS driven by these differences as data points.
The most visible features are (i) most IFS points
lie on the line connecting the lower left and upper right corners of the square, and
(ii) a noticeable number of IFS points lie on the line connecting the
lower right and upper left corners of the square. Evidently, bin2 and
bin3 contain do contain a fair number of points that occur in many combinations
(though not all - do you see some gaps along this line? What are the addresses of the
empty regions? |


