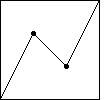
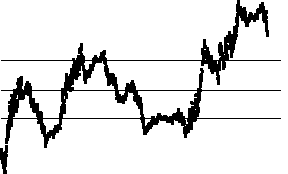
| Here are the successive differences of the cartoon data. The bin boundaries are
set so bin1, bin2, bin3, and bin4 contain
about the same number of data points. |
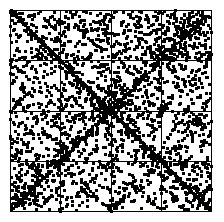
Here is the IFS driven by these differences as data points.
As expected, squares 1, 2, 3, and 4 have about the same number of IFS points.
There is a visible clustering of IFS points along the diagonal from
(0,1) to (1,0) (data points hop between bin2
and bin3 in all combinations), and along the antidiagonal from
(0,0) to (1,1) (data points hop between bin1 and
bin4 in all combinations). |


