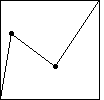
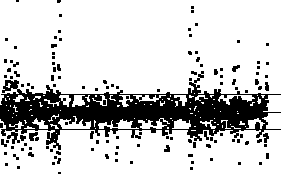
| Here are the successive differences of the cartoon data. Note most differences
lie in bin2 and bin3, few in bin1, and bin4.
The change from B1 and B3
one-quarter of the range below and above
B2 to one tenth of the range increases the number of data points in
bin1 and bin4, but not substantially. |
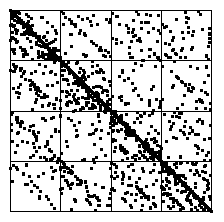
Here is the IFS driven by these differences as data points.
Most of the IFS points cluster along the diagonal between (1,0)
and (0,1). The subdiagonal (between (1/2,0) and
(0,1/2)) is more heavily occupied than the suberdiagonal
(between (1,1/2) and (1/2,1)). |


