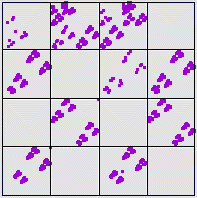
| On the left is the IFS driven by 10000 iterates of the s = 3.99
logistic map with equal-size bins. |
| Address Stats gives these occupancies |
|
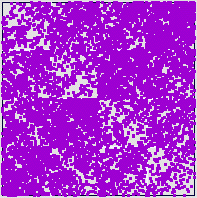
| On the right is an IFS driven by a uniform random data set, with the bin boundaries set to
given the length 1 address occupanices of the logistic driven IFS. |
| Certainly we don't need
careful statistics to believe the differences between these pictures are significant. But to prepare
for data sets that are less obviously different, we examine the length 2 address occupanices, from the
Address Stats menu. |
|
| The most obvious differences lie in the addresses 12, 22, 13, 23, 32, and 44, empty in the
IFS driven by the logistic map, not at all in the random IFS. |
| The values of corresponding length 2 addresses are substantially different, but are they
significantly different? |
| Answering this question requires proper statistical hypothesis testing. Here is an
example to give an indication of the issues involved. |


