| An early quantitative assessment of this effect was done by
Lewis Richardson in 1961. |
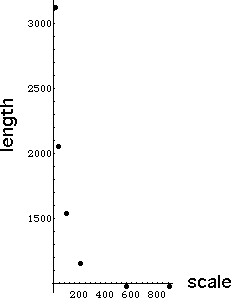
| For the coast of Australia and of South Africa, the west coast of Britain, and the
land frontiers of Germany and Portugal, Richardson measured the lengths L(d)
at different scales d. |
| The left graph shows his data for the west coast of
Britain. |
| Richardson observed that as the scale is reduced, the length increases
rapidly. |
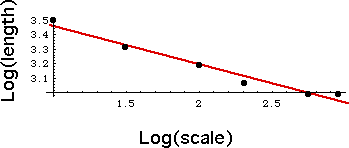
| This and the other graphs looked like
power laws, so Richardson
plotted Log(length) vs Log(scale), as shown in the right figure. |
|
| In all his examples, Richardson found the points were well-fit by a
straight line with slopes |
| s = -0.25 for the west coast of Britain, one of the roughest in the atlas, |
| s = -0.15 for the land frontier of Germany, |
| s = -0.14 for the land frontier of Portugal, |
| s = -0.02 for the South African coast, one of the smoothest in the atlas. |
|
| For circles and other smooth curves, for small enough scale the points fall on
a line of slope 0. |
 |
| Consequently, Richardson showed that most coastlines differ significantly from
smooth curves. |
| But what does this slope tell us? Mandelbrot found an interpretation. |