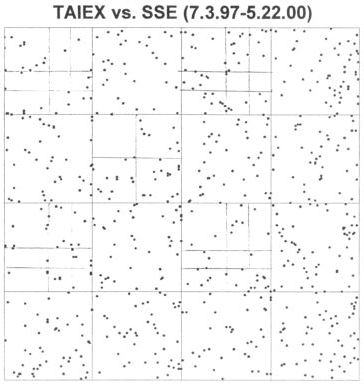
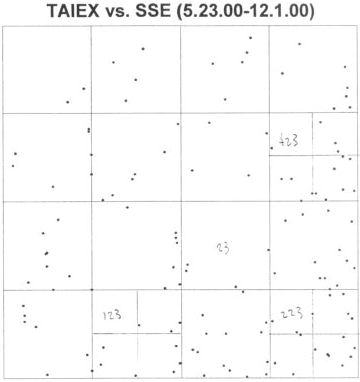
| Here are driven IFS plots using data (left) before May 22, 2000, the inauguration of
Taiwan's new president, and (right) after May 22, 2000. |
|
| In the longer record, Wu observed the subsquare with address 323
is empty. This is plausible, because this address signals a rise, fall, and rise
of the TAIEX, and corresponding fall, rise, and fall of the SSE. |
| After the inauguration of the new president, Wu observed |
| (1) most points land in squares with address 2 and 4, signaling declines in the TAIEX, |
| (2) the small population of points in addresses 33 and 44 indicate few consecutive falls in
the SSE, and |
| (3) the larger number of points in square 22 shows there were many
consecutive falls in the TAIEX, simultaneous with rises in the SSE. |
| Although we must be careful with deductions made on such small data sets, the general
observation matches known trends: China's market continued to grow, while
Taiwan's lost over half its value in this time period. |
| Of course, we don't
need driven IFS to notice this. However, driven IFS are good at detecting
fairly long and convoluted correlations in the data. |